This post is part 3/4 of my Visualizing Latency series.
Now that I have introduced the D3 latency heatmap chart component and explained what binning is, I can discuss the primary use case of the chart: rendering event data.
What is event data
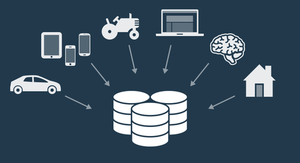
First, I must explain what I mean by event data. For a fuller treatment, please read Analytics For Hackers: How To Think About Event Data, but allow me to summarize: Event data describes actions performed by entities. It has three key pieces of information: action, timestamp, and state. It is typically rich, denormalized, nested, schemaless, append-only, and frequently extremely large. Some examples of event data include system log records, financial market trades, crime records, or user activities within an application.
When I created the D3 latency heatmap chart component, my primary use case was to be able to visualize the latency of a queue-based report generation system. This system logs every single report generation event, along with important data such as start time and duration, to a table inside a SQL server. I imagine there are thousands (or millions) of systems storing event data into SQL tables – and there’s absolutely nothing wrong with that – but event data is also frequently stored in append-only files on filesystems, in stream processing systems like Apache Kafka, or in distributed databases like Apache Cassandra.
When rendering event data, the key decisions are around binning:
- What sizes should the bins have?
- How should binning be implemented?
- Where should binning be performed?
What sizes should the bins have
This question was discussed in my blog post where I explained what binning is. The short answer it “it depends on your chart size and data distribution.” As you create your chart, be prepared to try out multiple different binning sizes.
How should binning be implemented
Let’s explore a few common alternatives for implementing binning.
SQL
The process of binning is conceptually equivalent to the process of a SQL GROUP BY, which leads to one possible implementation: in SQL itself.
Consider a table of events with the following (slightly unrealistic) definition:
|
|
Let’s say we want to bin the x-axis (time) by day, and the y-axis (value) into buckets of 10 (i.e. a bin for values from 0-10, another from 10-20, etc.) Here’s one way to write that query in SQL:
|
|
Given the above query, changing the size of the bins is simple and straightforward.
How fast is this query? I measured the above query on my development laptop in Microsoft SQL Server 2016 with a table with 1 billion records on it, as well as various candidate optimizations, below:
| Test Case | Duration (seconds) | Throughput (records/second) | Comments |
|---|---|---|---|
| Base case | 10.23 | 97.7 million | |
| Use of COUNT(1) instead of COUNT(*) | (statistically indistinguishable) | (statistically indistinguishable) | As expected, COUNT(1) has no performance impact. |
Data sorted by dt then val (CREATE CLUSTERED INDEX IX_events_dt_val ON dbo.events(dt, val))) |
(statistically indistinguishable) | (statistically indistinguishable) | I was hoping to eliminate the need for sorts in the query, but perhaps the query optimizer can’t tell that the group by expressions are order-preserving. |
Columnstore table (CREATE CLUSTERED COLUMNSTORE INDEX) |
3.238 | 308.8 million | Reads are much faster but writes might be slower. |
Memory-optimized table (CREATE TABLE … WITH (MEMORY_OPTIMIZED=ON)) |
(insufficient memory) | N/A | Apparently 16GB allocated to SQL Server isn’t enough. |
| Memory-optimized table with 10,000,000 records | 1.052 | 9.5 million | Throughput is highly suspicious but memory-optimized tables are generally optimized for OLTP not analytics. |
Other possibilities which I did not test include:
- Different
GROUP BYexpressions to see if they are more efficient or the optimizer can determine that they are order-preserving - An event table that stores date and time in separate columns, as a data warehouse might
- Memory optimized tables with columnstore indexes
- Memory optimized tables with natively compiled queries
Conclusion: Don’t spend too much time on query optimization, but consider storing your events in a columnstore table rather than a rowstore table.
Imperative (Traditional) Programming Languages
Another approach to binning is to do it in an imperative programming language (e.g. JavaScript, C#, Java, etc.) Here are a few potential avenues to explore:
- Accumulate counts in a dictionary/map/hash table which is keyed by (xval, yval).
- Using something like LINQ and expressing the query in a form that’s similar to the SQL query above.
- If the data is already properly ordered, and your group by expressions are order-preserving, use this information to be able to process the data piece-by-piece rather than having to keep everything all in RAM.
I’m personally intrigued by #3, as I doubt most general-purpose analytical systems or libraries use this optimization technique.
Stream Processing Systems
Another possible place where binning could be performed would be within a stream processing system. Imagine a near-realtime D3 latency chart rendering binned data from Apache Flink cluster which is continuously aggregating and binning raw event data from a Kafka event bus, or from an Amazon Kinesis Data Analytics SQL query.
Where should binning be performed
My recommendations are as follows:
- If you’re dealing with streaming data, do it in the streaming analytics system (Apache Flink, etc.)
- If your data set is small, and you want to support responsive dynamic rebinning of the data (e.g. a dropdown where the user can select whether they want to bin the x-axis by day, month, quarter, or year), pull the raw event data into the web browser and perform the binning there. Pay careful attention to the amount of data you are transferring over the network and the amount of RAM you require. Consider presorting the events by date when retrieving the data from your data store.
- If your data set is medium-sized, or you want to use third-party libraries, pull the raw event data into the web server and perform the binning there. Network bandwidth and RAM usage are far less of a concern here than within a web browser, but you must still mind them. Consider presorting the events by date when retrieving the data from your data store.
- If your data set is very large, consider binning inside the data storage system (e.g. the SQL server) as part of data retrieval (a.k.a. move compute to data not data to compute).
What do I mean by “small”? The answer is, of course, “it depends”, but here’s how I try to break it down. Let’s say we want to be able to render the chart in 5 seconds or less, and that we’ll allocate 2.5 seconds to downloading the data and 2.5 seconds to the JavaScript execution and rendering. If we estimate the target (95th percentile) user has an Internet connection of 1MB/sec, we can transfer no more than 2.5MB of data. If we transfer the data compressed, and the compression achieves a 10:1 ratio, this is 25MB of raw data, which I imagine shouldn’t be a problem to store in RAM. If a single event is 100 bytes uncompressed, we can transfer no more than 250,000 events to the browser.
Naturally, the above recommendations do not take into account all possible considerations. For example, if you pull the raw event data into a web browser, you may now have to solve a new problem: How to keep the data in the web browser up-to-date? This problem doesn’t exist if you perform the binning where the data resides. On the other hand, if you bin inside your data storage system, what additional I/O, CPU, or cache pressure will you add to the server, and how will this interact with the existing utilization profile of the storage system? As with everything, it’s all about tradeoffs.