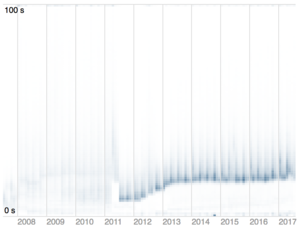
D3 Latency Heatmap
Visualization
Published: 2018-10-19

In the fall of 2017, I was researching a performance problem with a job queueing system. I was trying to figure out how I could better visualize the response time of the system in order to understand what was going on and I ran across the excellent article Brandon Gregg’s Latency Heat Maps. I could not find an easy-to-use, reusable latency heat map chart component, so I decided to make my own in d3.js.
After this, I: